How to Combine Google Search Console and Analytics in One Dashboard
Stop switching between GSC and GA4. Learn the different ways to merge your search and analytics data into a single view.
Google Search Console shows you how your site performs in search results - impressions, clicks, CTR, and average position. Google Analytics 4 tells you what happens after the click - sessions, pageviews, bounce rate, and engagement. Separately, each tool gives you half the picture. Together, they show you the full journey from search result to site behavior.
The problem is that Google does not make it easy to see both datasets side by side. You end up with two browser tabs, two different date pickers, and no way to correlate a spike in impressions with a change in sessions without manual work.
The native GA4 integration
Google offers a built-in link between GA4 and Search Console. In your GA4 property, go to Admin → Product Links → Search Console Links and connect your GSC property. This adds two reports to your GA4 sidebar: Google Organic Search Queries and Google Organic Search Traffic.
These reports are helpful but limited:
- You can only link one GSC property per GA4 data stream
- Data is sampled at high volumes
- You cannot overlay GSC metrics on GA4 charts - they live in separate report sections
- No support for comparing date ranges across both datasets
For a single site with moderate traffic, the native integration might be enough. For anyone managing multiple properties or needing daily trend analysis, it falls short.
Looker Studio dashboards
Looker Studio (formerly Google Data Studio) is the most popular way to build a combined dashboard. You add both GSC and GA4 as data sources, then blend them using the landing page URL as the join key.
Advantages:
- Free to use
- Highly customizable charts and tables
- Can combine data from many sources
- Shareable with team members
Drawbacks:
- Setup takes time - you are building a dashboard from scratch
- Blended data sources can be slow and have row limits
- Data freshness depends on connector caching (often 12+ hours)
- Still requires managing each property separately if you have multiple sites
Third-party tools
Tools like AgencyAnalytics, Semrush, and Analytics Edge offer pre-built dashboards that pull from both GSC and GA4. They solve the setup problem but add cost - typically $50-200/month depending on the number of properties.
| Approach | Cost | Setup time | Multi-property | Self-hosted |
|---|---|---|---|---|
| Native GA4 link | Free | 5 min | No | No |
| Looker Studio | Free | 2-4 hours | Manual | No |
| AgencyAnalytics / Semrush | $50-200/mo | 30 min | Yes | No |
| Sitelytics | Free (open source) | 15 min | Yes | Yes |
Building your own with the Google APIs
If you want full control, you can build a dashboard directly against the Google APIs. The Search Console API v3 provides search analytics data (impressions, clicks, CTR, position) with filtering by query, page, country, and device. The GA4 Data API exposes sessions, pageviews, engaged sessions, bounce rate, and more.
Both APIs use OAuth 2.0 authentication. You request the webmasters.readonly and analytics.readonly scopes, then call each API to fetch data for the same date range. The challenge is aligning the data correctly - GSC reports on search appearance dates while GA4 reports on visit dates, which can differ slightly.
How Sitelytics solves this
Sitelytics is an open source dashboard that fetches data from both the Search Console API and the GA4 Data API, then presents everything in a single interface. It is built with Rust (Axum) on the backend and React on the frontend.
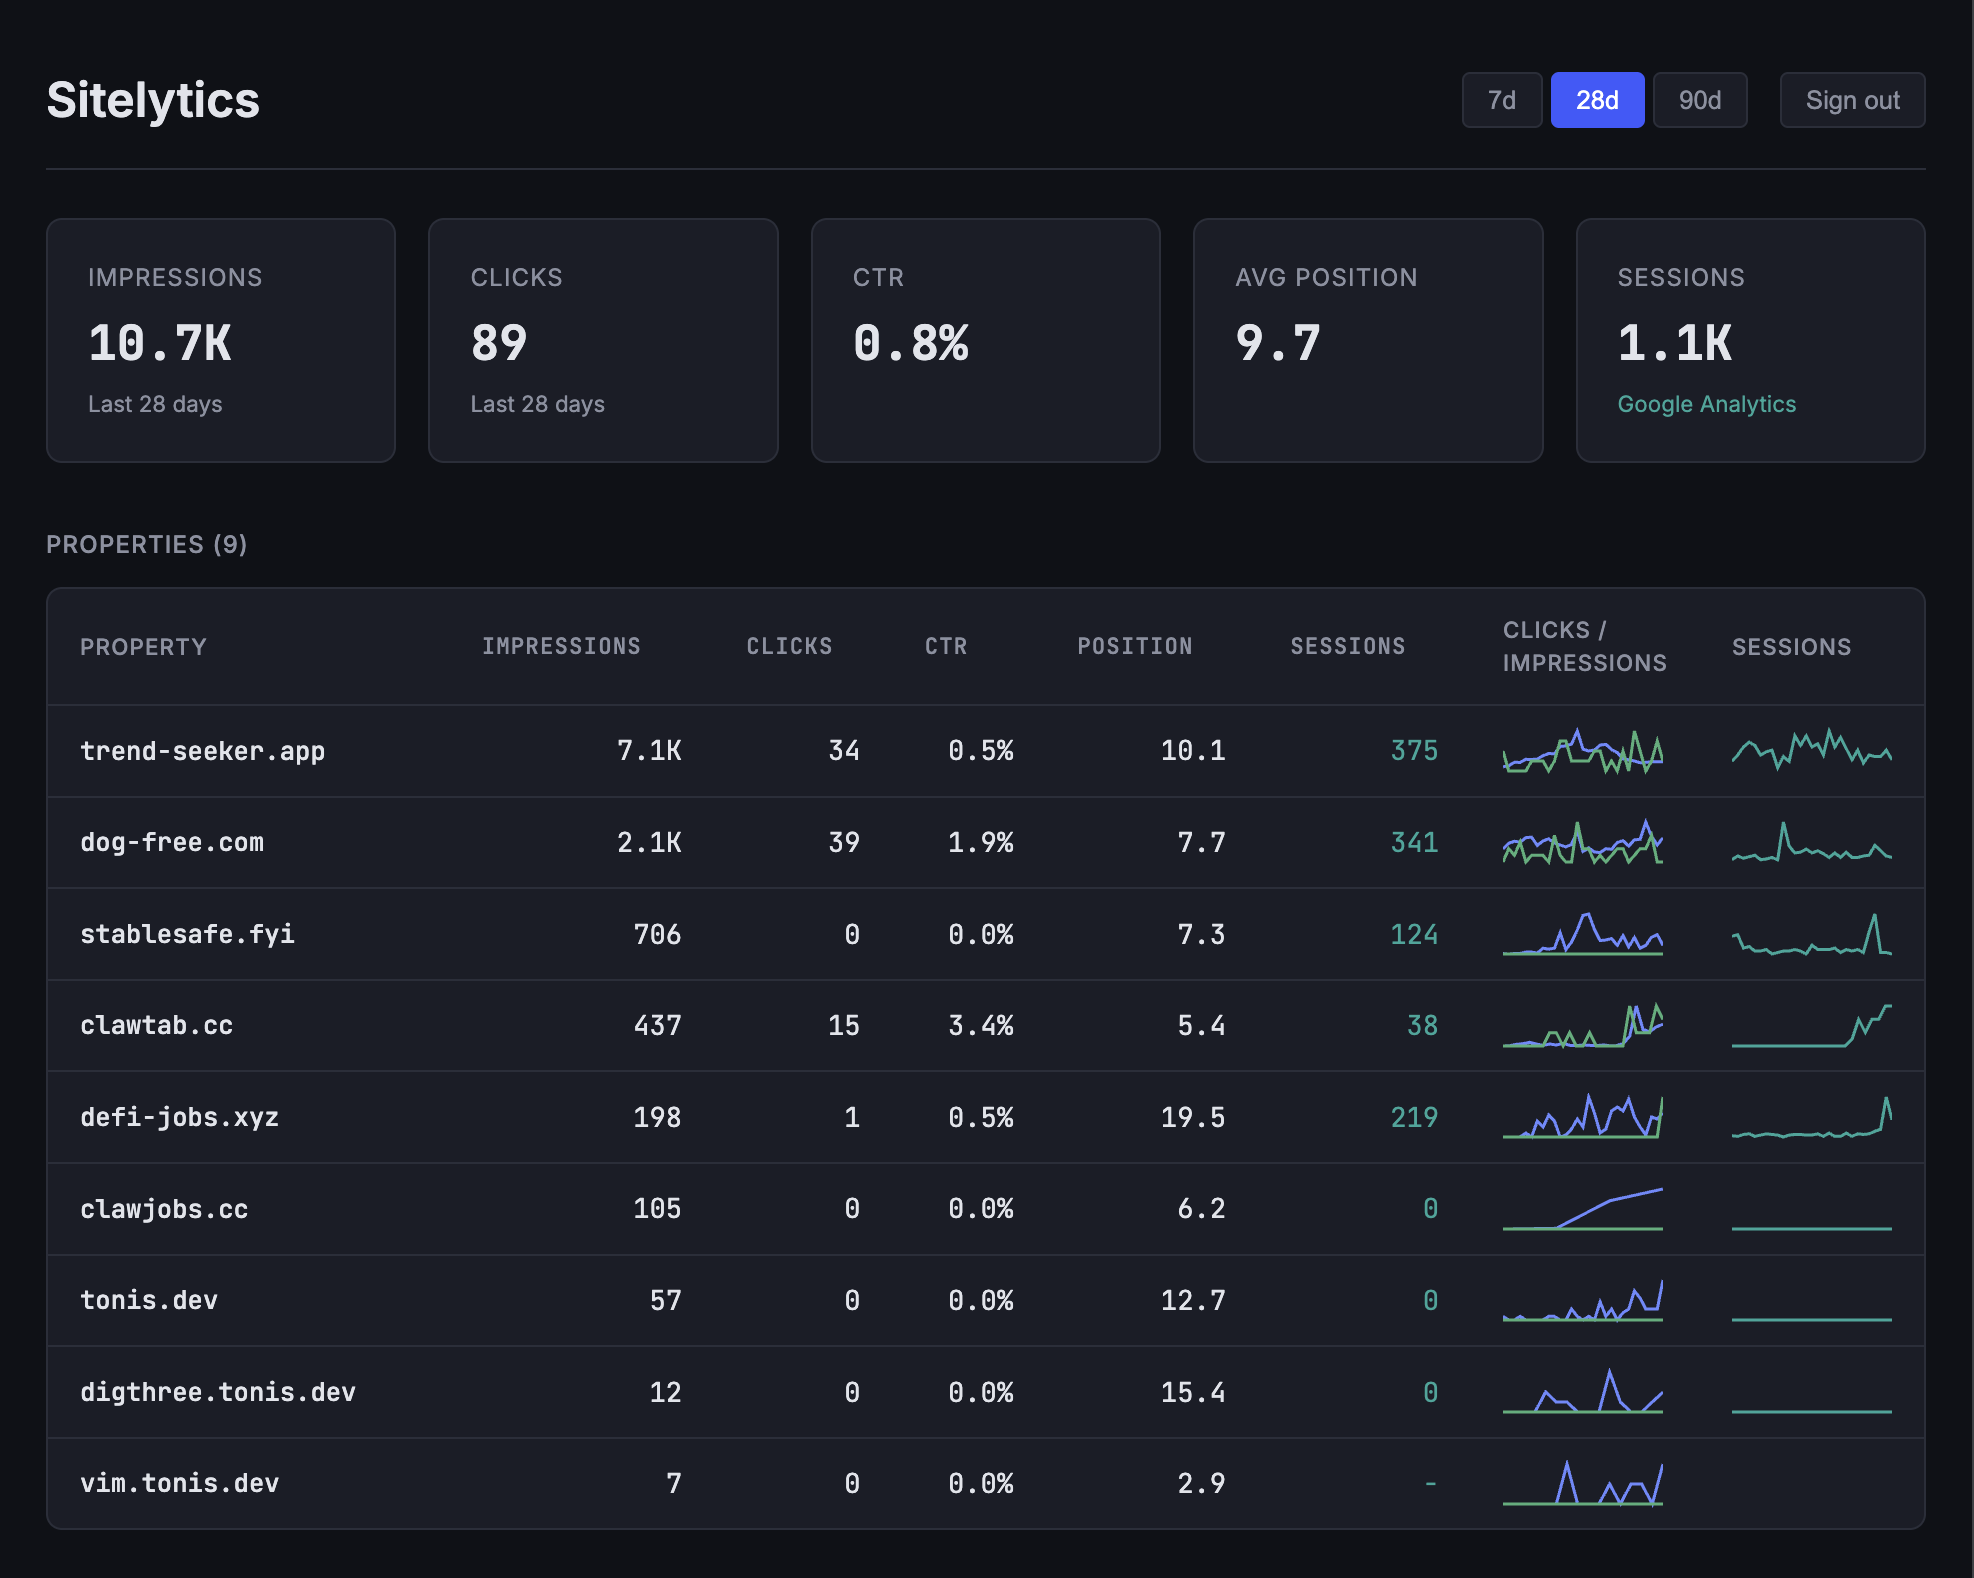
Key differences from the approaches above:
- Multi-property by default - all your GSC properties appear on one screen with aggregate totals
- GA4 sessions overlay - sessions from Google Analytics are shown alongside GSC metrics on the same charts
- Self-hosted - your data never leaves your infrastructure
- Fast API responses - Rust backend with client-side caching means no waiting for dashboard loads
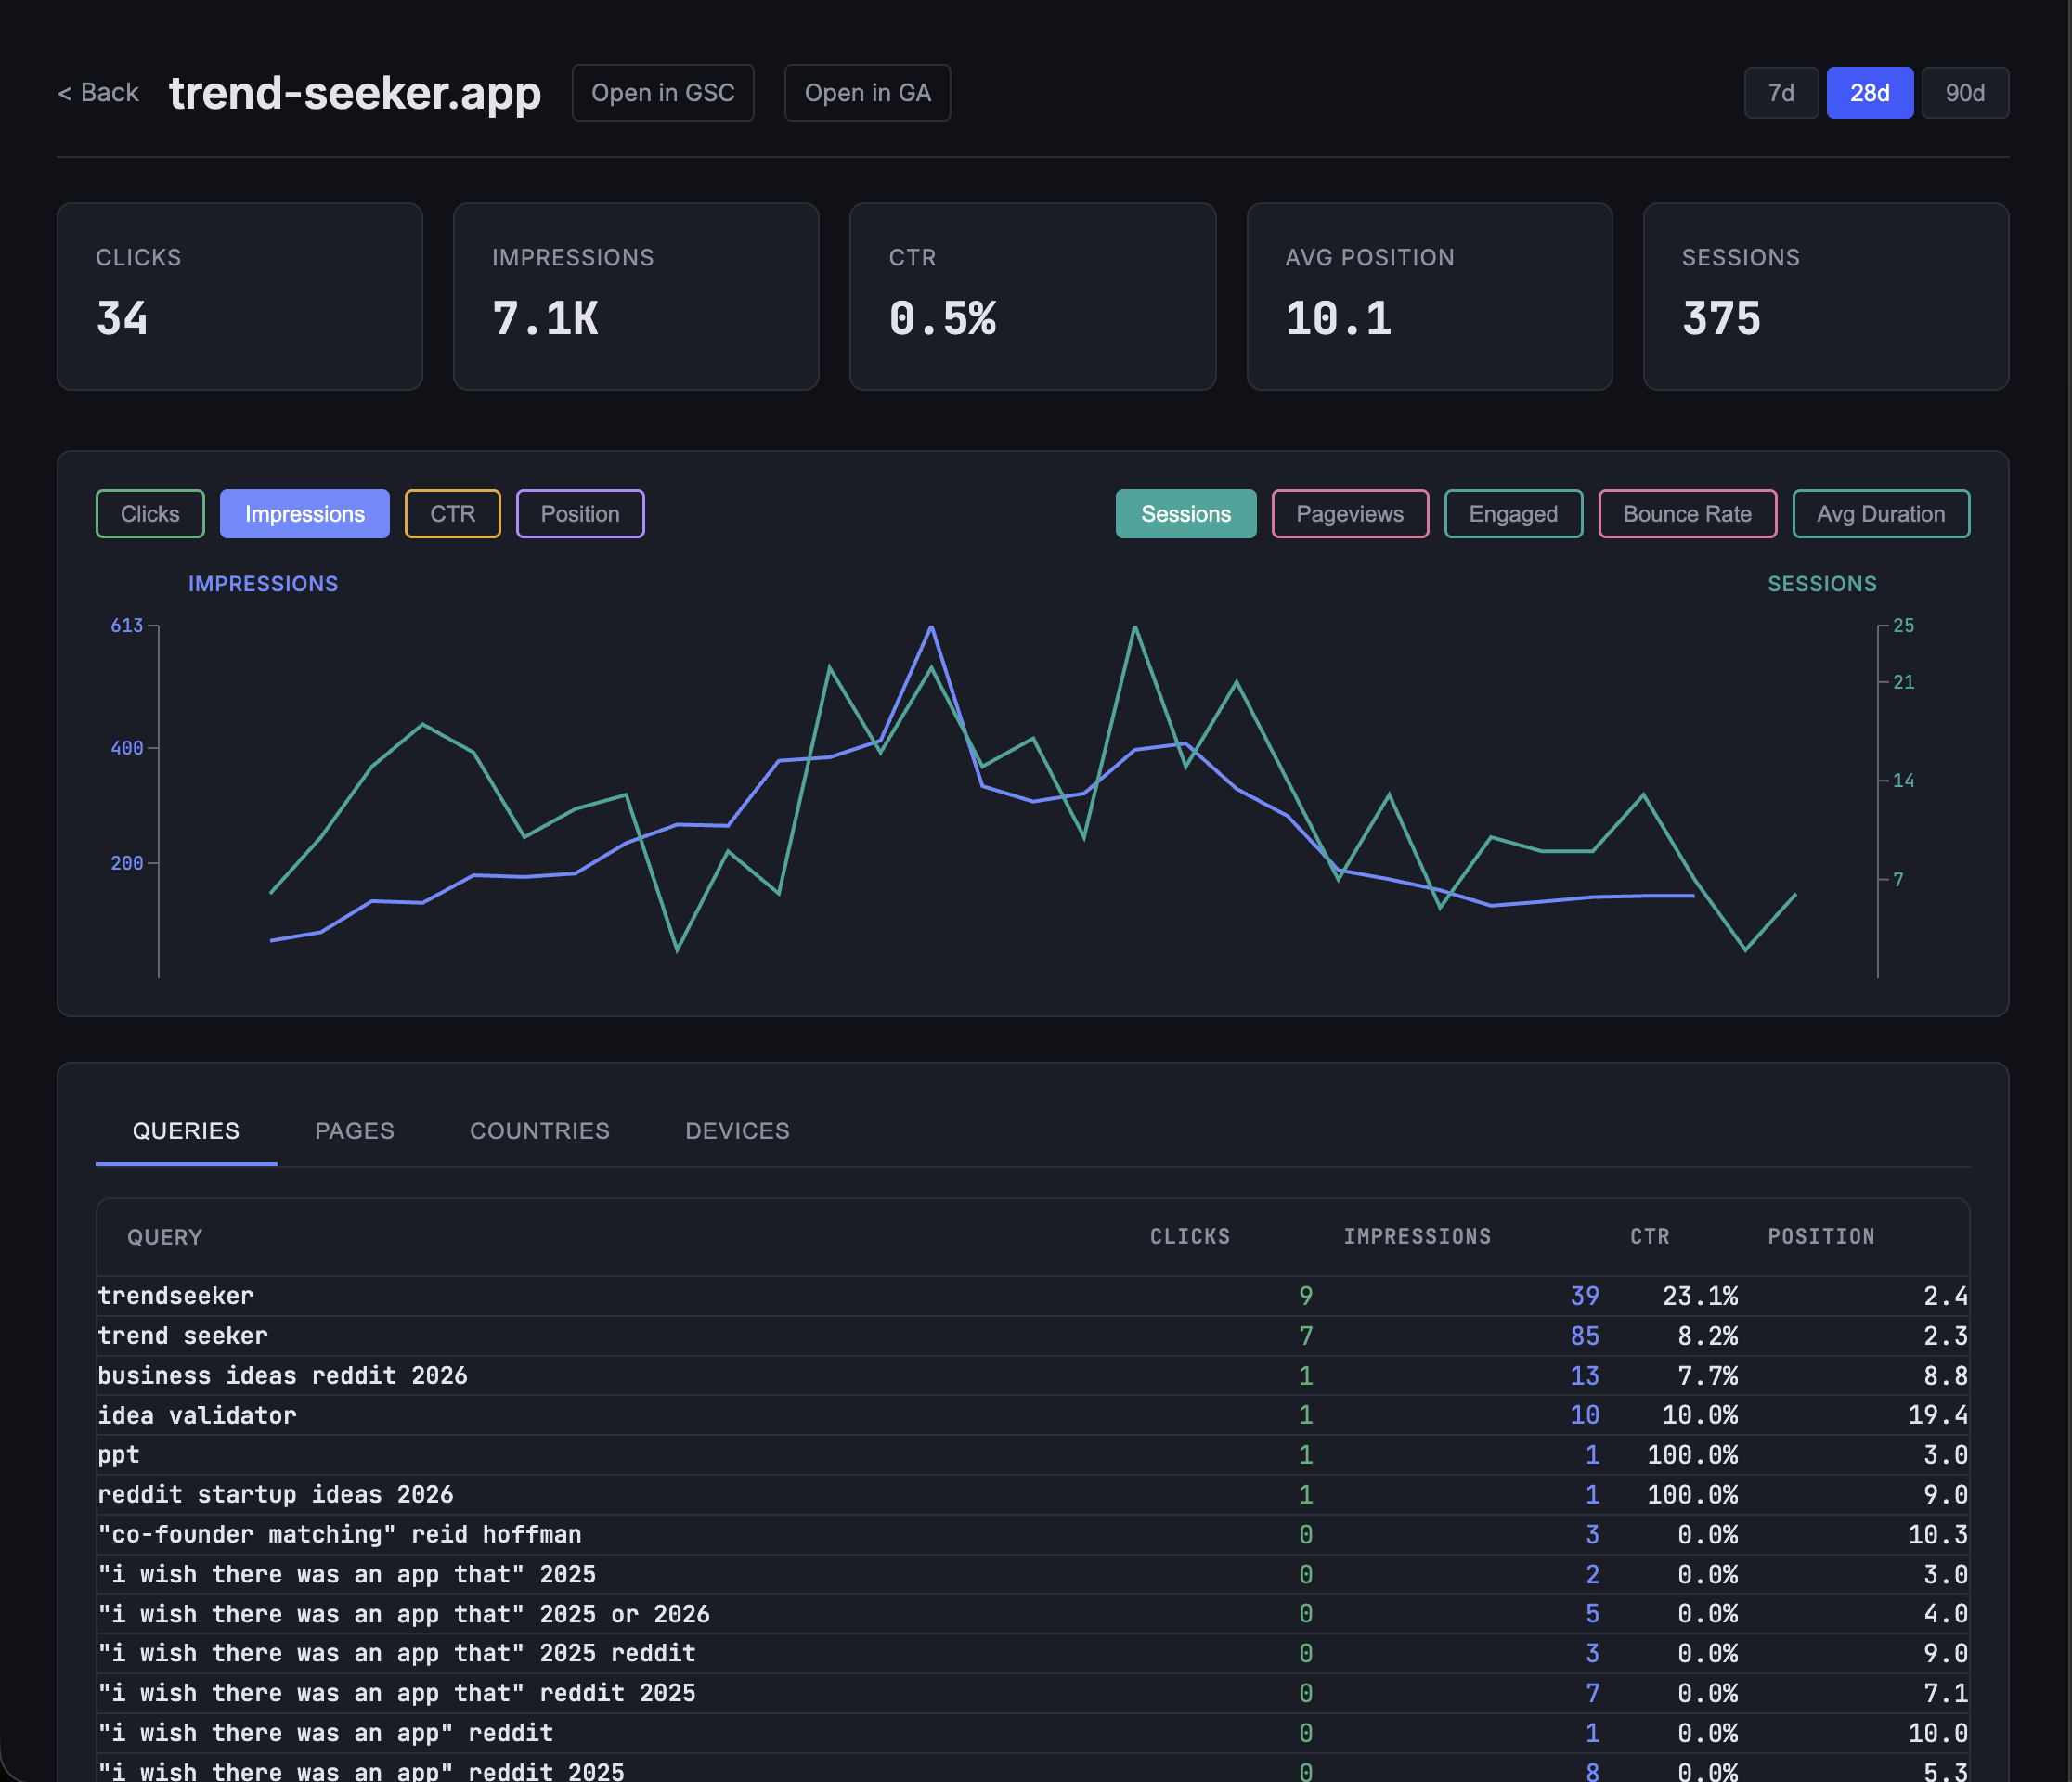
You can drill into any property for daily trend charts, toggle between metrics, and break down performance by search queries, landing pages, countries, and devices.
Getting started
If you want to try Sitelytics, you need a Google Cloud project with OAuth 2.0 credentials and the Search Console and Analytics APIs enabled. The full setup takes about 15 minutes:
git clone https://github.com/tonisives/sitelytics
cd sitelytics

# Set your Google OAuth credentials
export GOOGLE_CLIENT_ID="your-client-id"
export GOOGLE_CLIENT_SECRET="your-client-secret"

# Start the backend
cargo run

# In another terminal, start the frontend
cd frontend && pnpm dev
See the setup guide for detailed instructions on configuring Google Cloud Console, enabling APIs, and adding OAuth redirect URIs.