Features
Sitelytics aggregates Google Search Console and Google Analytics 4 data into a single dashboard. Monitor all your web properties without switching between Google tools.
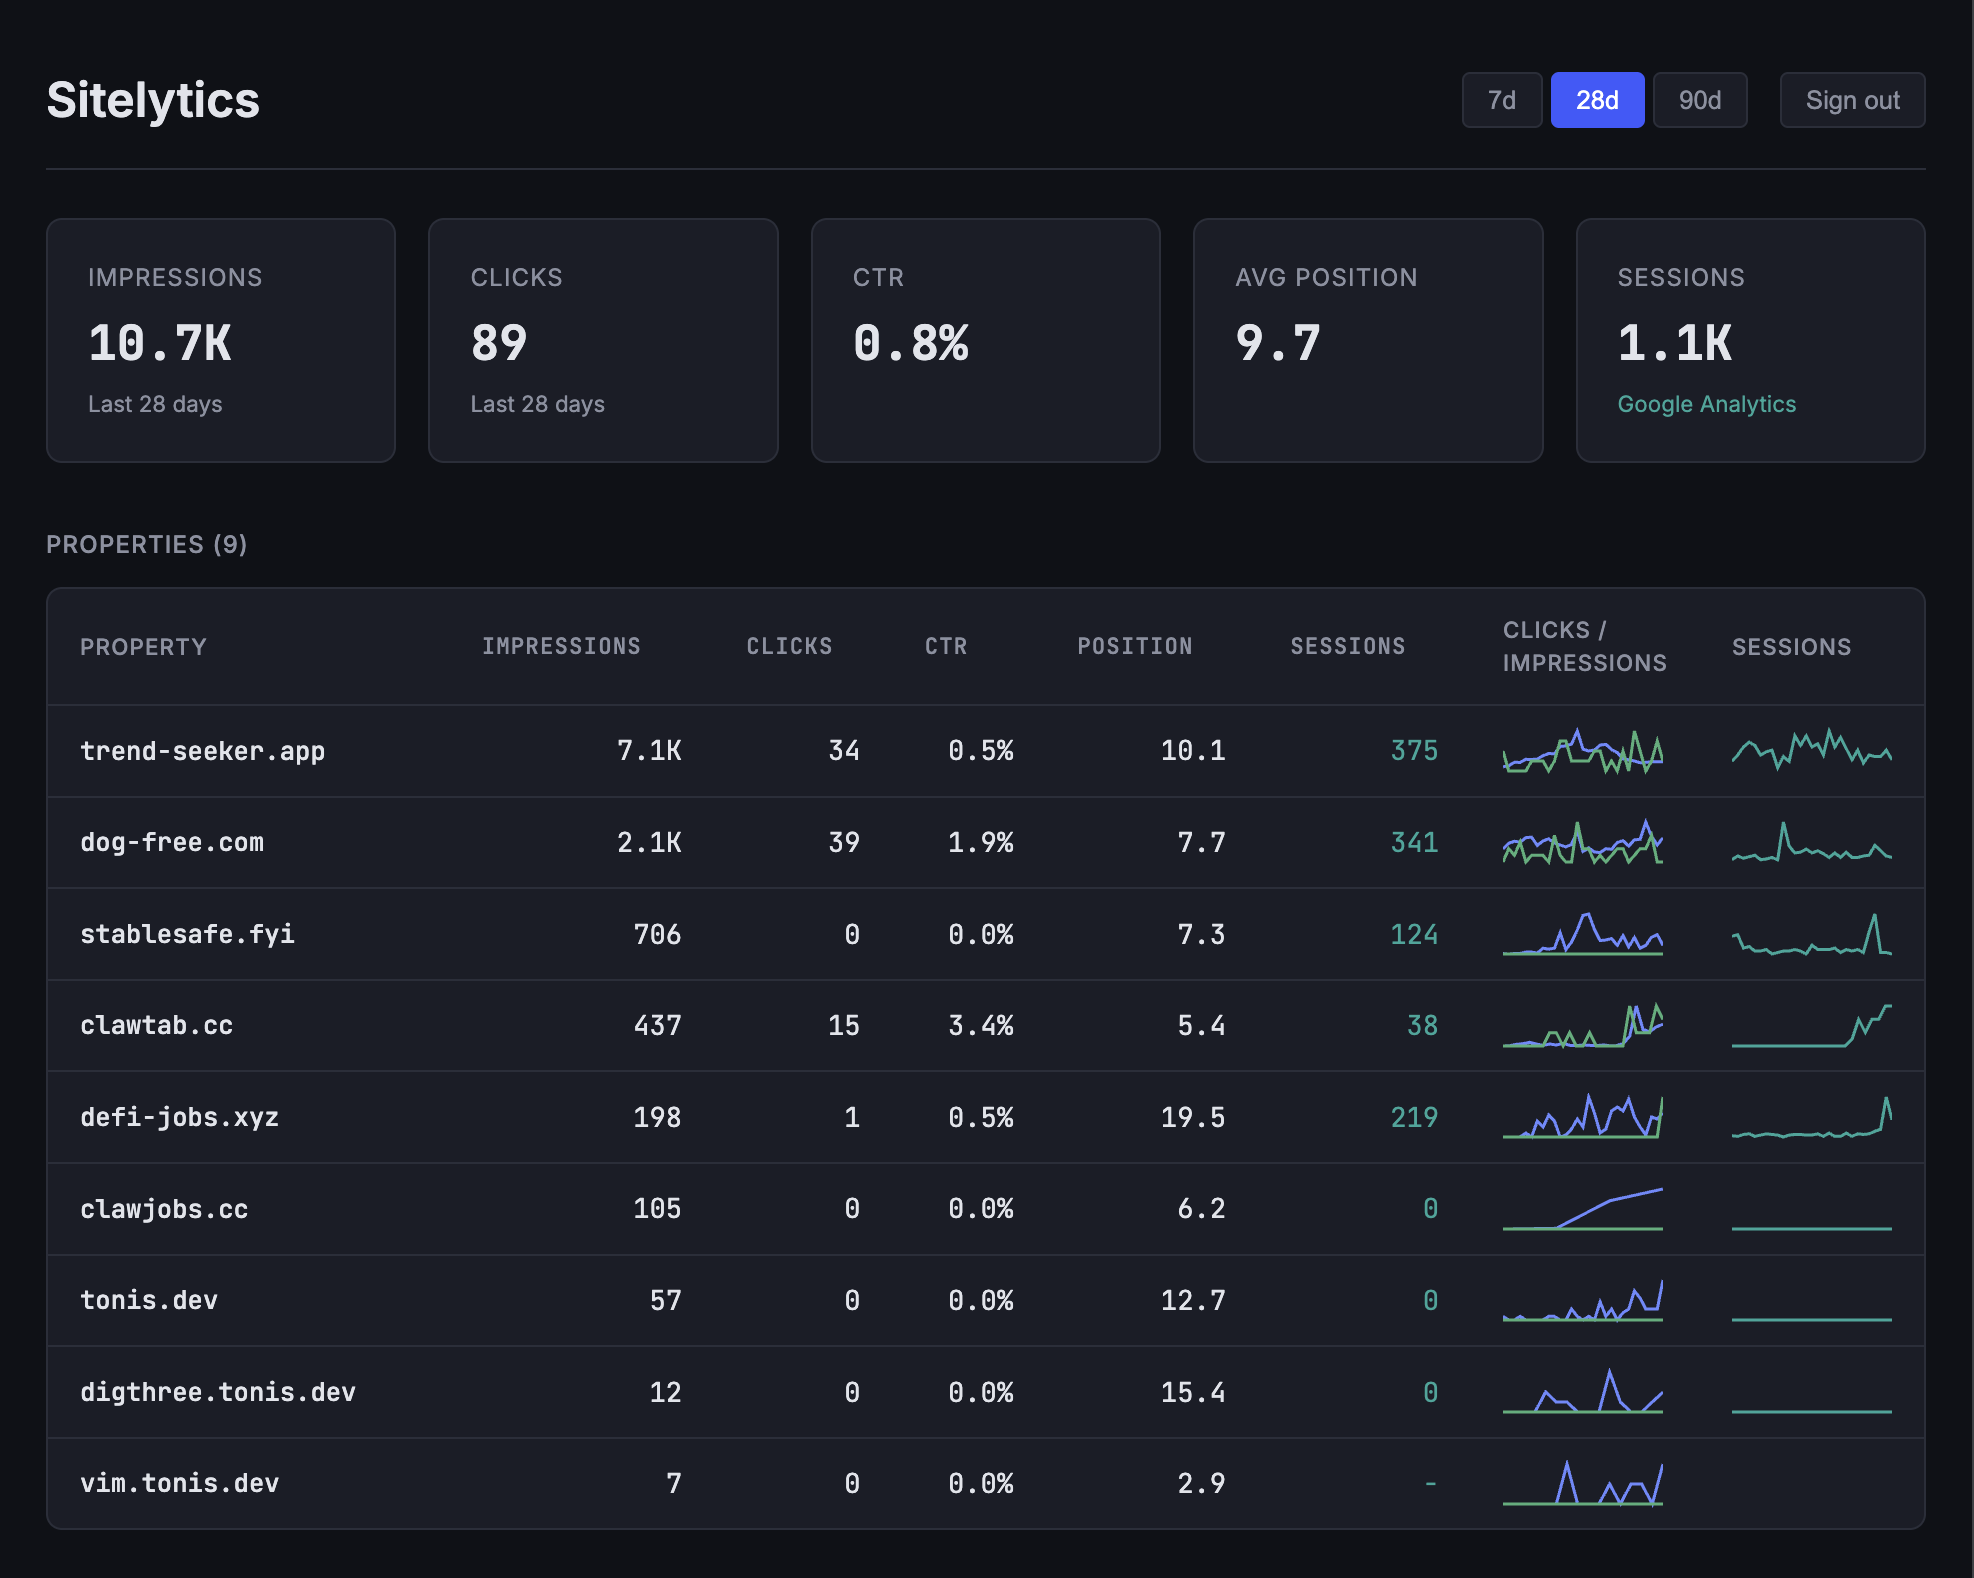
Multi-property dashboard
See aggregate impressions, clicks, CTR, average position, and GA4 sessions across all properties. Each property row includes sparkline trends for clicks and impressions so you can spot changes at a glance.
Interactive charts
Drill into any property for daily performance charts. Toggle between clicks, impressions, CTR, and position. GA4 metrics overlay on a secondary axis - sessions, pageviews, engaged sessions, bounce rate, and average duration.
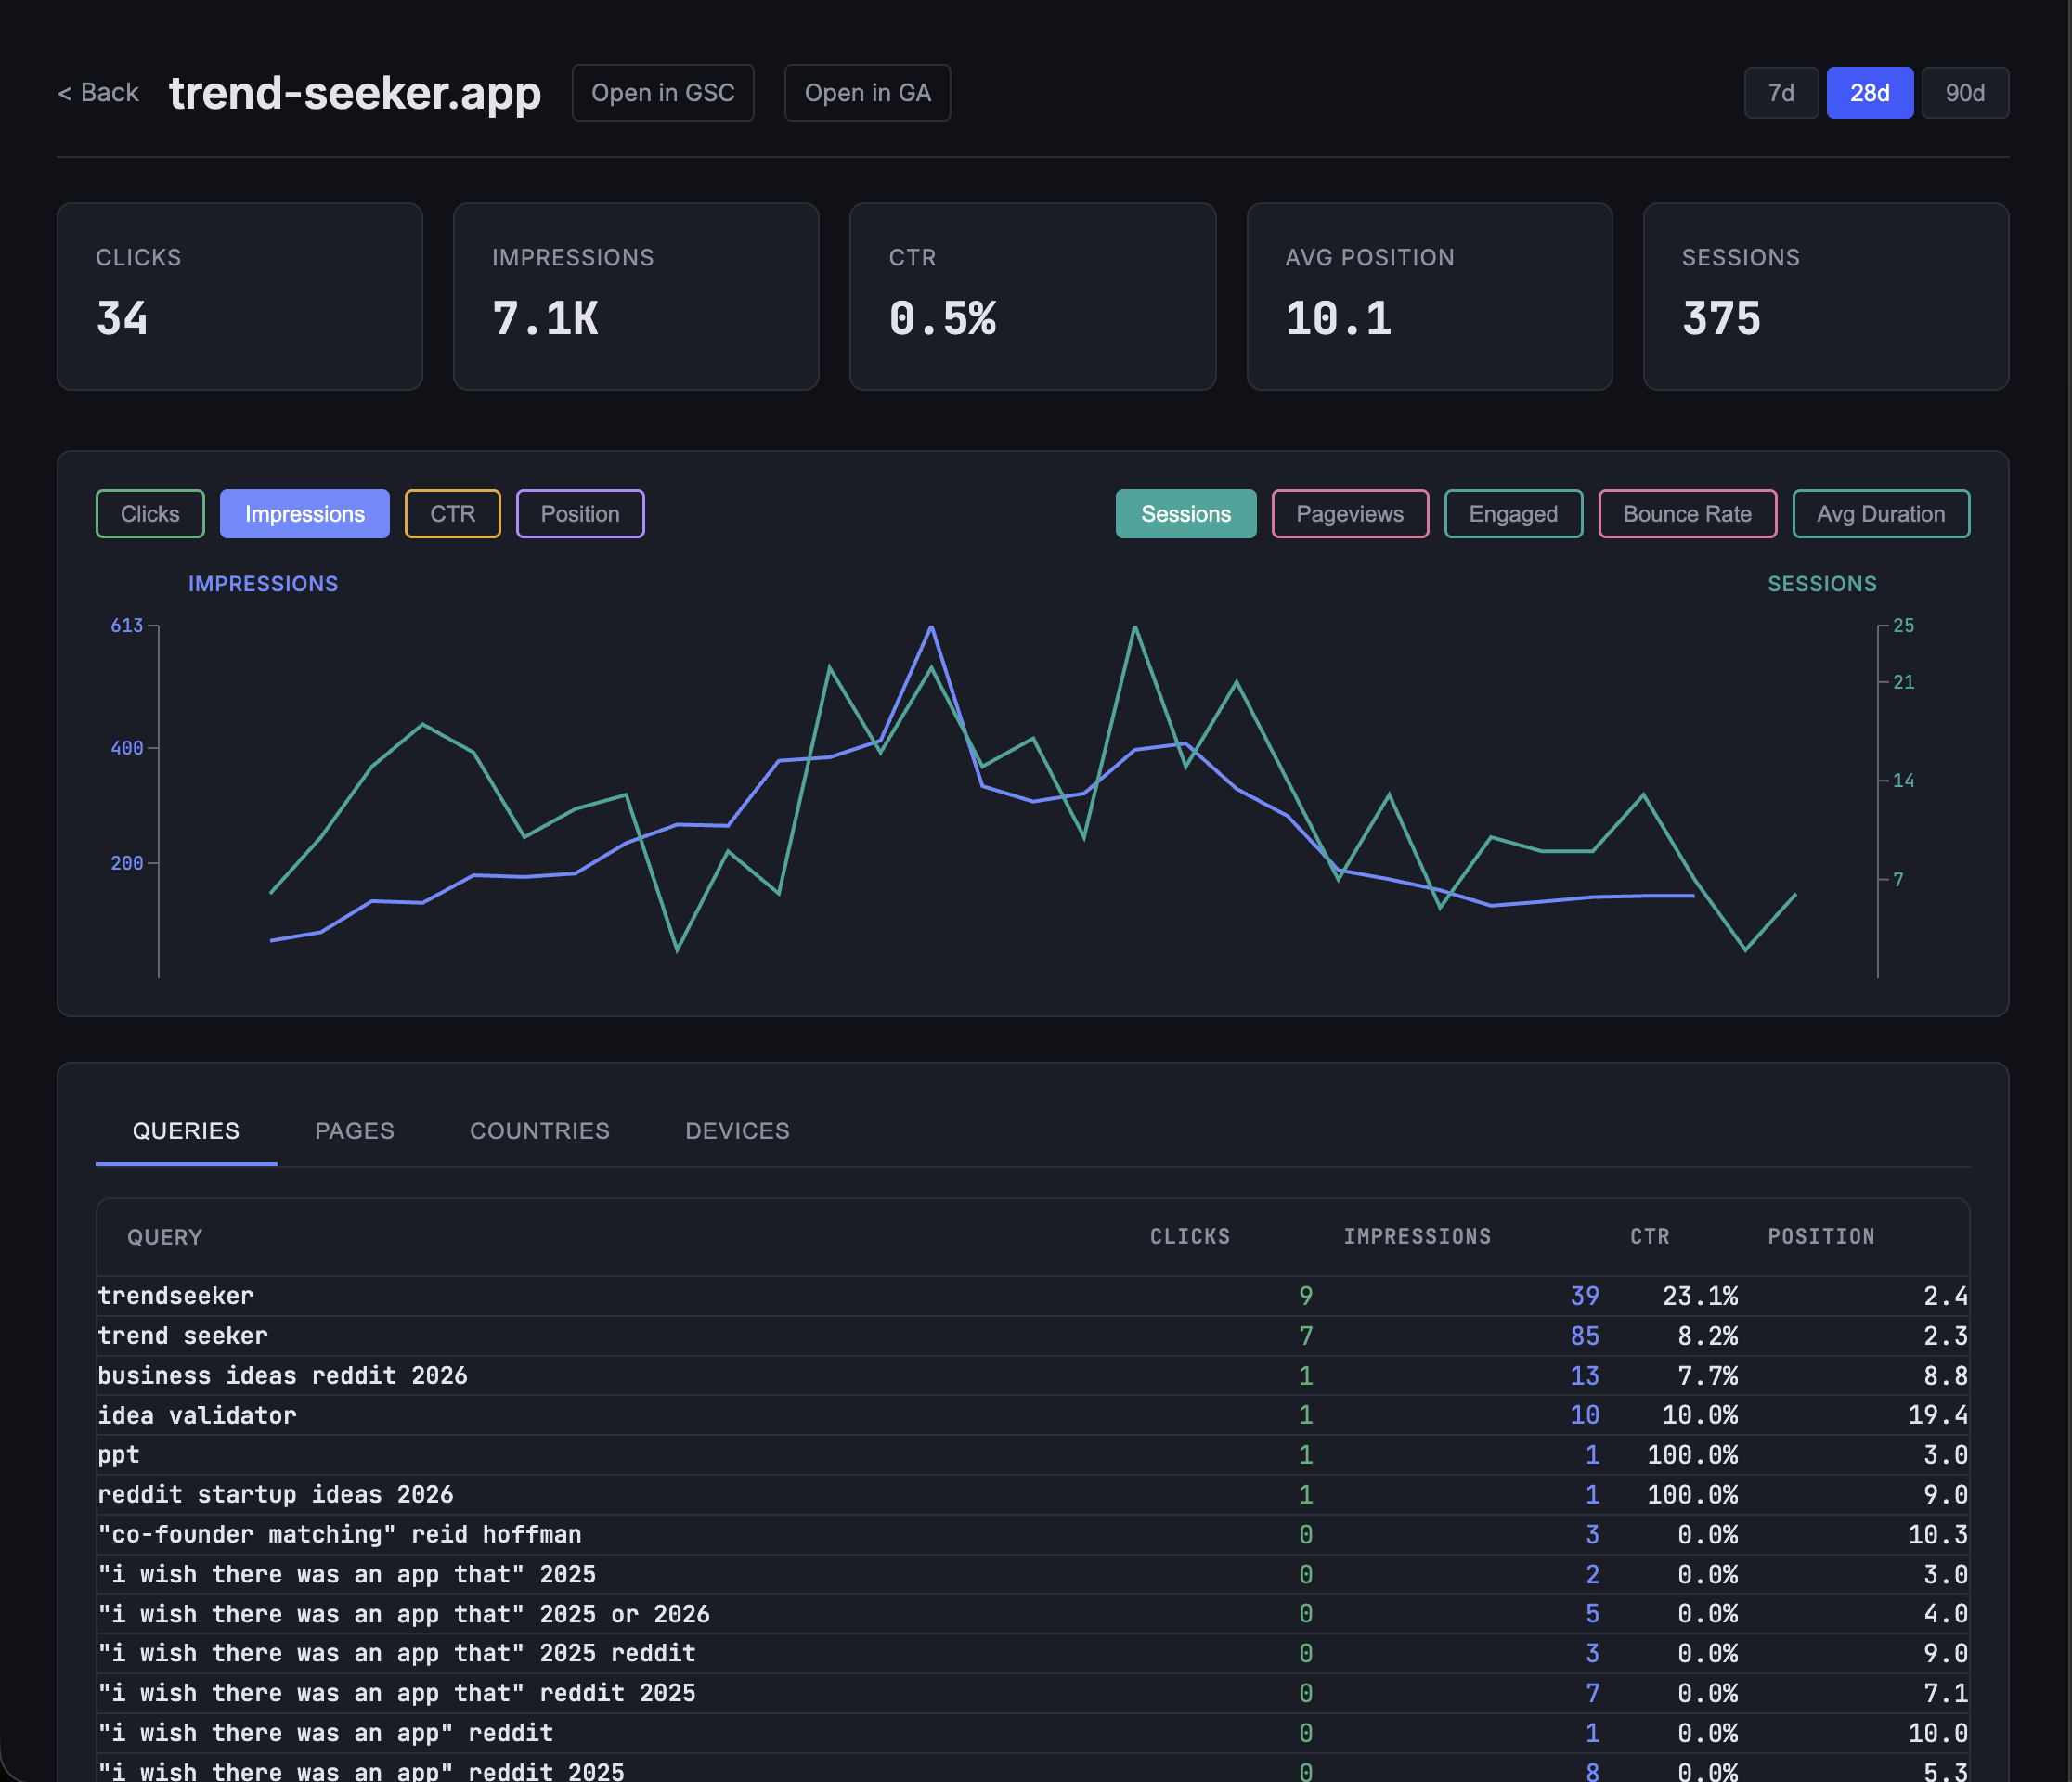
Dimension breakdown
Analyze performance by search queries, landing pages, countries, and device types. See clicks, impressions, CTR, and average position for each dimension row.
Date ranges
Switch between 7, 28, and 90 day windows. Both the dashboard totals and detail charts update to reflect the selected range.
GA4 sessions
Sessions from Google Analytics 4 are fetched alongside GSC data. Dashboard shows total sessions per property; detail view shows daily session trends on charts.
Client-side caching
API responses are cached in-memory. Navigate between the dashboard and property details without redundant API calls to Google.
Tech stack
| Component | Technology |
|---|---|
| Backend | Rust, Axum 0.8, Tokio async runtime |
| Frontend | React 19, TypeScript, Recharts |
| Rendering | Server-side rendering with Fastify + client hydration |
| Auth | Google OAuth 2.0 with cookie-based sessions |
| APIs | Google Search Console v3, GA Admin v1beta, GA Data v1beta |
| Styling | Light and dark theme with CSS custom properties |