Managing Multiple Google Search Console Properties in One Place
If you run several websites, managing them individually in GSC is painful. Here is how to aggregate metrics across all your properties.
If you manage more than a handful of websites, Google Search Console becomes tedious quickly. Each property lives in its own silo - you have to click through a dropdown to switch between them, and there is no way to see aggregate metrics across all your sites on a single screen.
This article covers the different approaches to managing multiple GSC properties, from Google's built-in features to third-party tools and API-based solutions.
How GSC handles multiple properties today
Google Search Console offers two types of properties:
- URL-prefix properties - cover a specific URL path (e.g.,
https://example.com/) - Domain properties - cover all subdomains and protocols for a domain (e.g.,
example.comincludeswww.example.com,blog.example.com, both http and https)
Domain properties help consolidate data for a single domain, but they do not help if you own multiple separate domains. For that, you just get the property selector dropdown in the top left corner.
Property sets (deprecated)
Google once offered "property sets" that let you group multiple properties together and see combined data. This feature was introduced in 2016 but has since been deprecated. There is currently no native way to view aggregate data across multiple distinct domains in GSC.
The pain points of managing multiple properties
Anyone running 5+ websites in GSC will recognize these problems:
- Context switching - clicking through the property dropdown to check each site, losing track of which ones you have already reviewed
- No aggregate totals - you cannot see total impressions or clicks across all your sites without manual addition
- No trend comparison - impossible to compare performance trends between properties side by side
- Slow navigation - each property switch triggers a full data reload
- Missed anomalies - with 10+ properties, a traffic drop on one site can go unnoticed for days
Approach 1: Looker Studio multi-property dashboard
You can build a Looker Studio report that pulls data from multiple GSC properties. Add each property as a separate data source, then use blended data or multiple charts to show them together.
This works but has limitations:
- Each property needs to be added as a separate data source manually
- Blending more than 5-6 sources becomes slow and error-prone
- Adding a new property means editing the dashboard configuration
- No automatic discovery of new properties - you have to know about them and add them
Approach 2: API scripts
The Search Console API lets you programmatically fetch data for any property your Google account has access to. You can write a script that:
- Lists all properties using
sites.list() - Fetches search analytics for each using
searchAnalytics.query() - Aggregates the results into a single report
This is flexible but requires development effort. You need to handle OAuth 2.0 authentication, rate limiting (the API has quotas), data storage, and building some kind of visualization layer. For a quick one-off check it works; for daily monitoring it becomes a maintenance burden.
Approach 3: Commercial tools
Tools like SearchBird, AgencyAnalytics, and Semrush offer multi-property GSC dashboards out of the box. They handle the API integration, data storage, and visualization for you.
| Tool | Multi-property view | Auto-discovery | GA4 integration | Pricing |
|---|---|---|---|---|
| Looker Studio | Manual setup per property | No | Yes (separate source) | Free |
| SearchBird | Yes | Yes | No | Paid |
| AgencyAnalytics | Yes | Yes | Yes | From $79/mo |
| Sitelytics | Yes | Yes | Yes | Free (open source) |
Approach 4: Sitelytics
Sitelytics was built specifically to solve the multi-property problem. When you sign in with your Google account, it automatically discovers all your Search Console properties and displays them in a single dashboard with aggregate metrics.
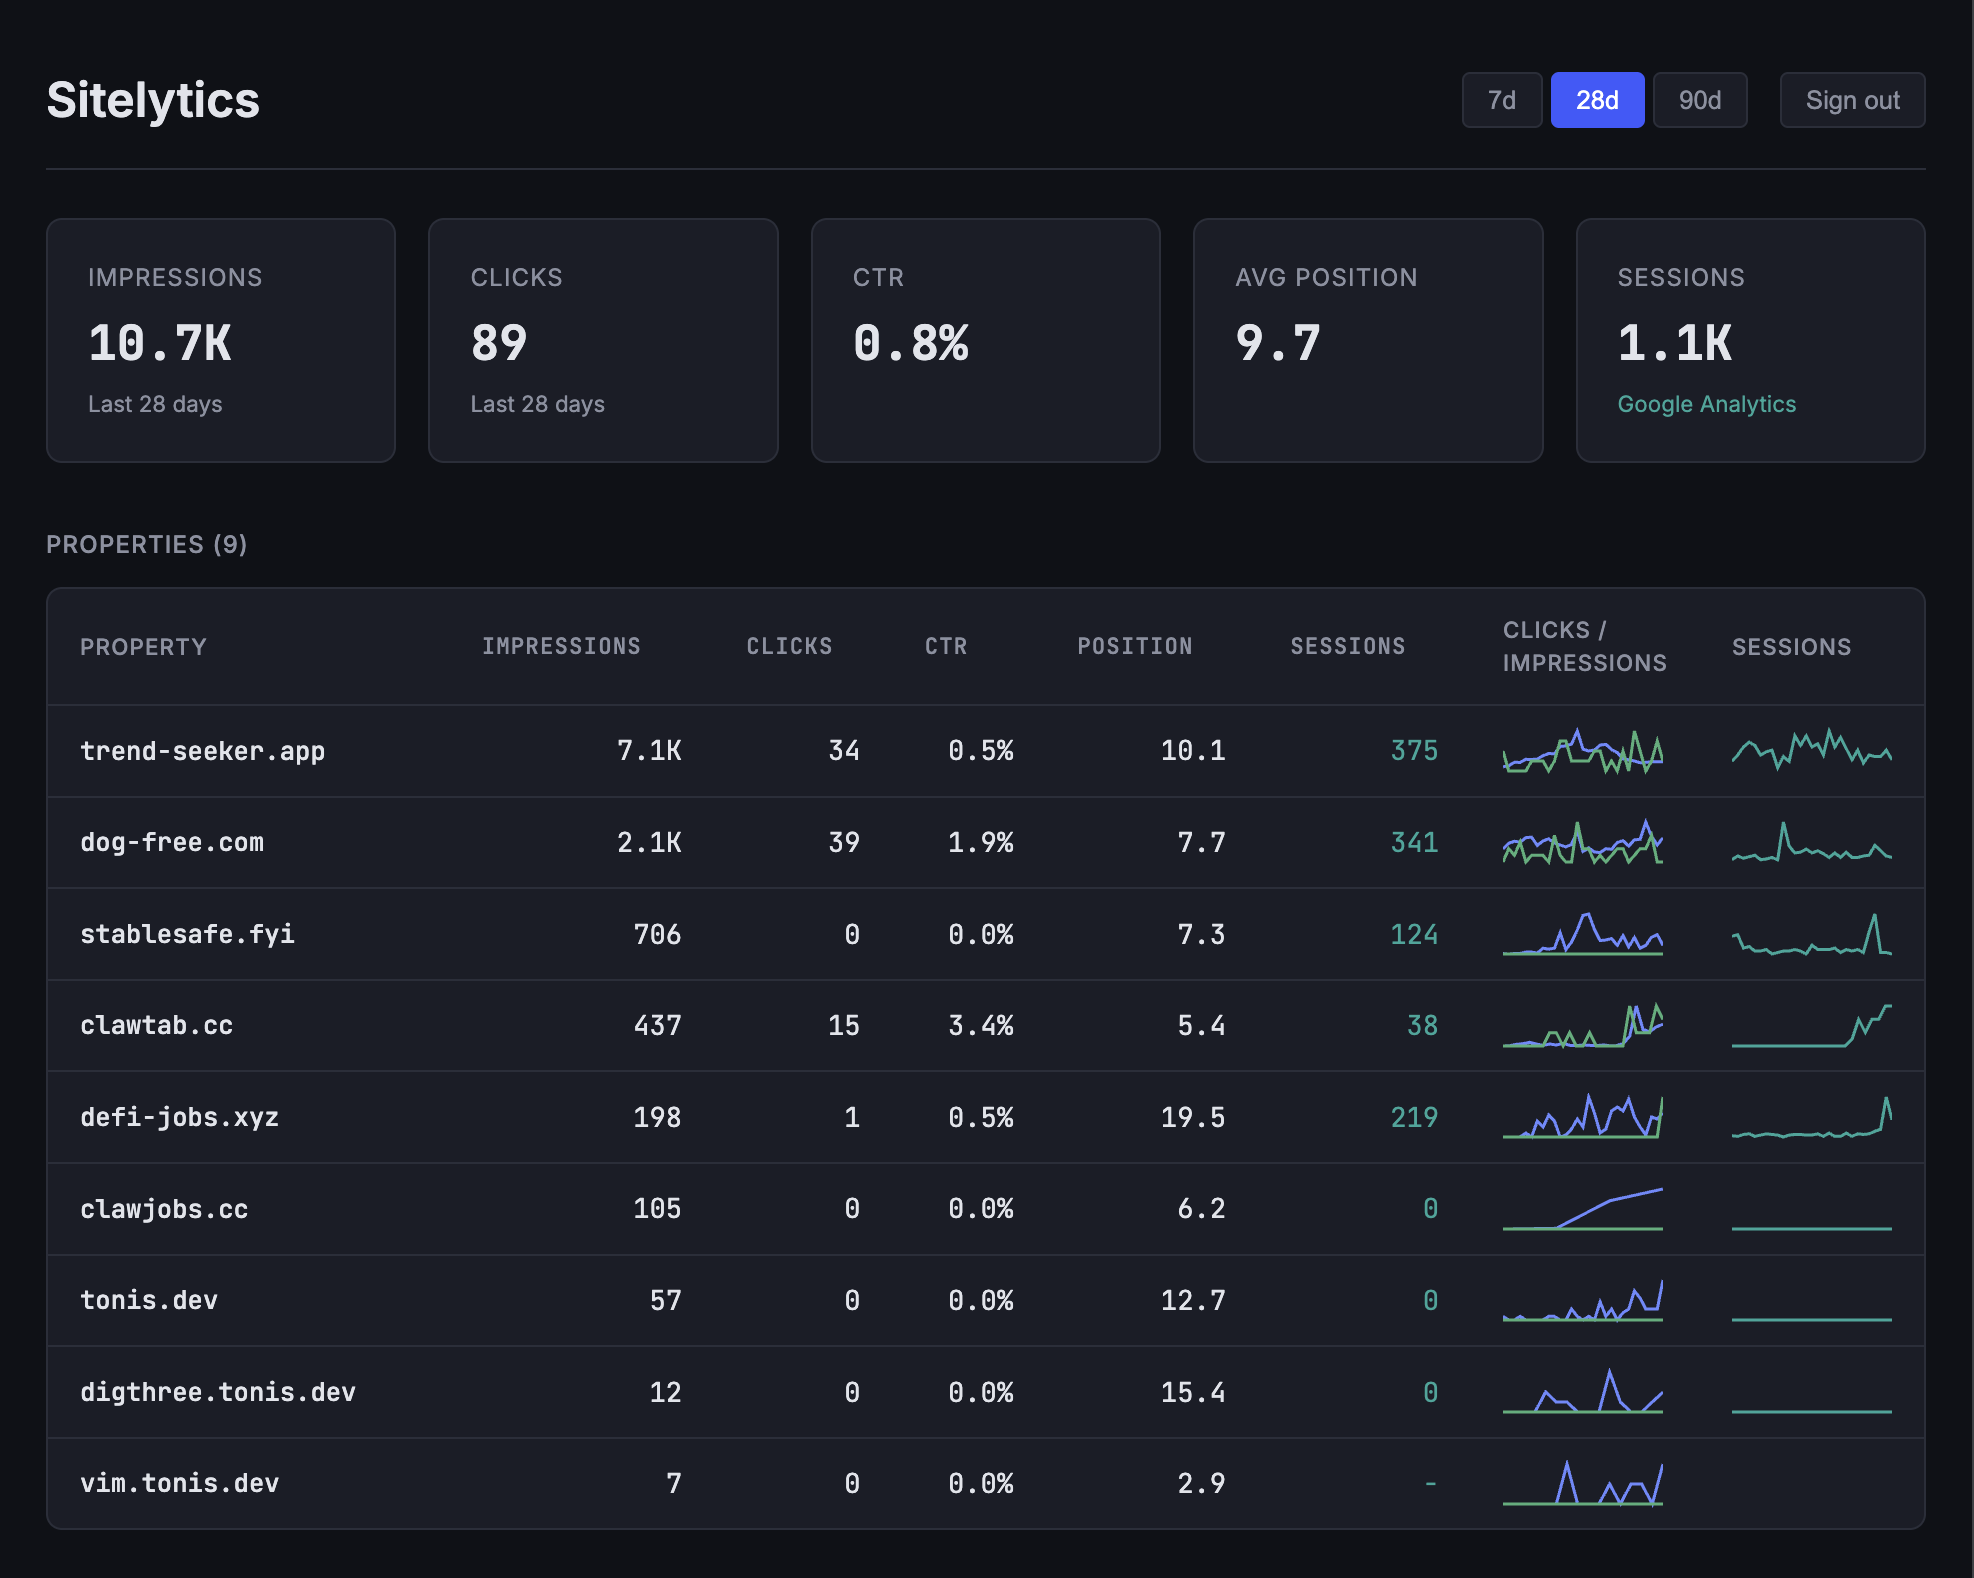
Each property row shows:
- Total impressions and clicks for the selected date range
- CTR and average position
- GA4 sessions (if Google Analytics is connected)
- Sparkline charts for clicks and impressions trends
The top of the dashboard shows aggregate totals across all properties, so you can see your overall search performance at a glance without any manual calculation.
Spotting anomalies across properties
The sparkline charts next to each property are particularly useful for spotting problems. If one site's impressions suddenly drop while others remain stable, you can see it immediately in the overview without clicking into each property individually.
Click any property row to drill into detailed charts with daily trends, toggleable metrics, and dimension breakdowns by queries, pages, countries, and devices.
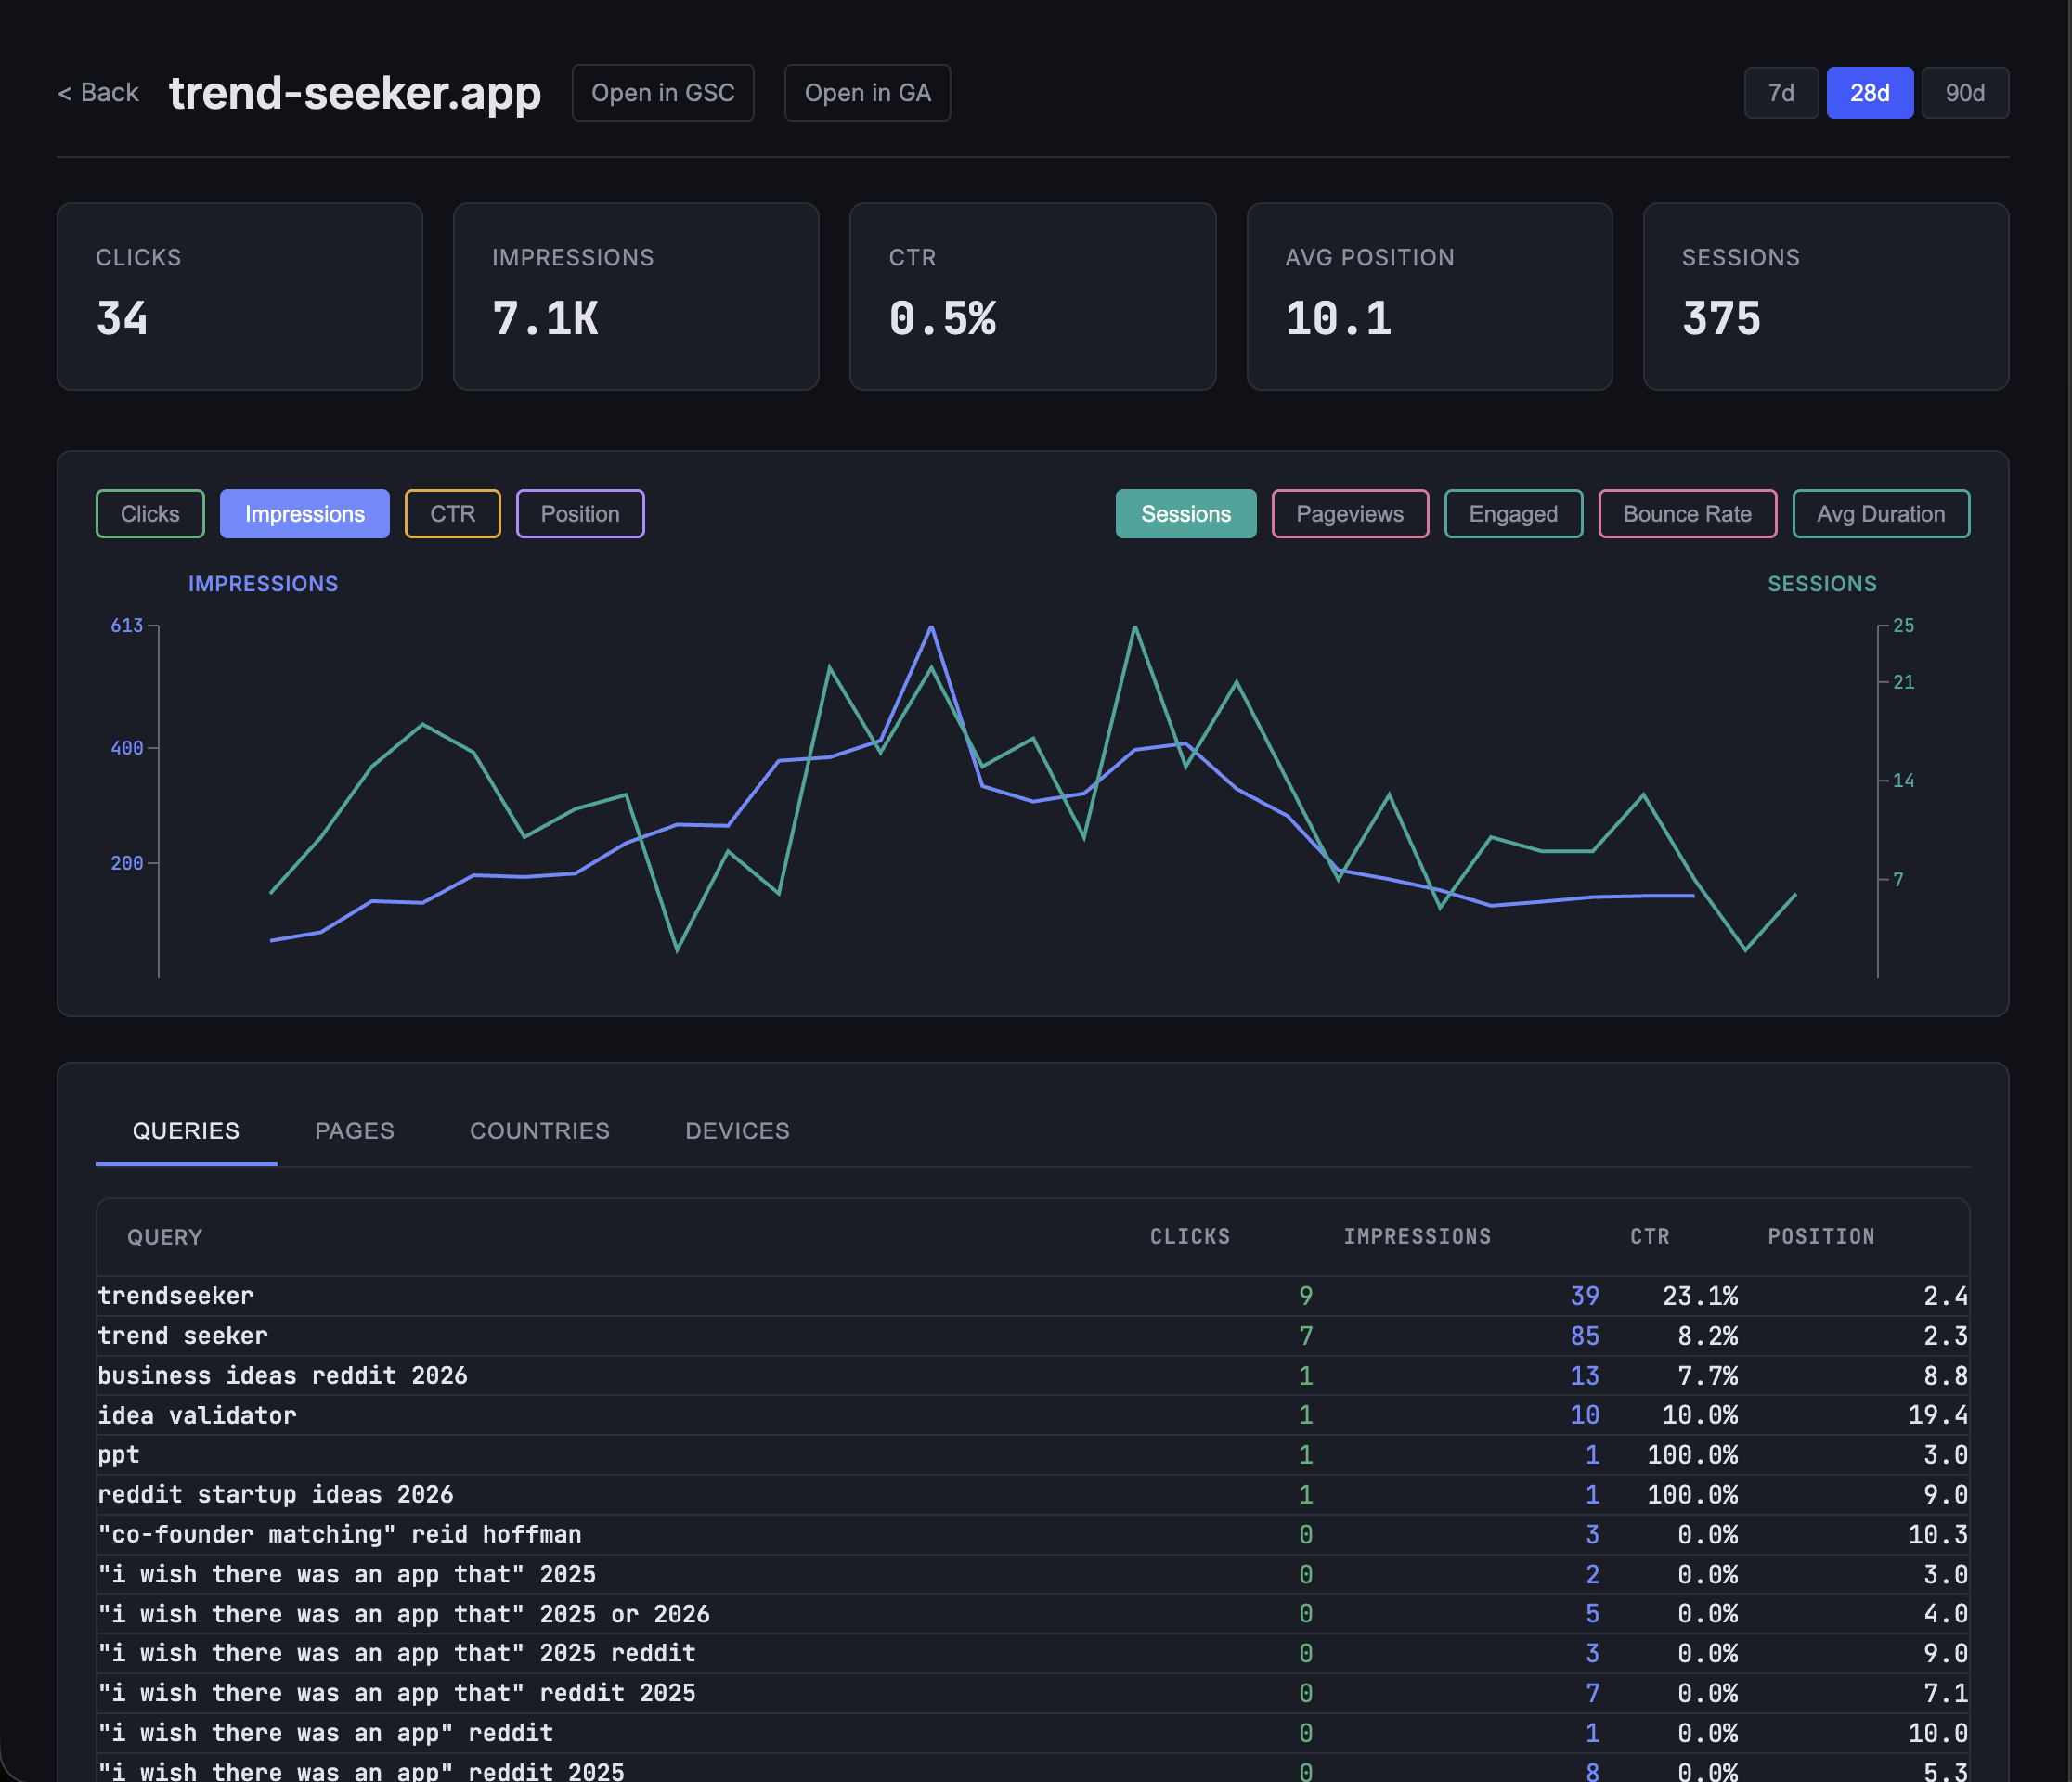
Date range switching
Switch between 7, 28, and 90 day windows. Both the dashboard totals and individual property data update to reflect the selected range, making it easy to compare short-term fluctuations with longer trends.
Setting up Sitelytics for multi-property monitoring
The setup requires a Google Cloud project with OAuth 2.0 credentials. You need to enable the Search Console API, GA Analytics Admin API, and GA Data API. The whole process takes about 15 minutes.
git clone https://github.com/tonisives/sitelytics
cd sitelytics

export GOOGLE_CLIENT_ID="your-client-id"
export GOOGLE_CLIENT_SECRET="your-client-secret"

# Backend
cargo run

# Frontend (separate terminal)
cd frontend && pnpm dev
Once running, sign in with your Google account and all your Search Console properties will appear automatically. No manual property configuration required.
Sitelytics is open source under the MIT license. The Rust backend keeps API responses fast even when fetching data for many properties, and client-side caching ensures smooth navigation between the overview and detail views.
See the full setup guide for step-by-step instructions including Google Cloud Console configuration.